- calendar_month October 5, 2022
- folder Real Estate
Absorption Rate Analysis: September 2022 (Mostly) Leans Harder Into a Seller’s Market
RE News October 4, 2022October 4, 2022 Seth Styles
Has it already been a month since our last absorption rate roundup? September’s numbers are in and we’re seeing most neighborhoods trending upward with higher absorption rates than August. If we’re using the universally accepted 20% indicator of a healthy seller’s market, then every neighborhood is still a seller’s market. But as our CEO and founder Harout Keuroghlian mentioned last time around, it’s up to the professionals to really interpret what these numbers mean. There are a couple of exceptions to the upward trend keeping things interesting. Let’s take a closer look at September’s data.
Absorption Rates – September 2022
- Long Beach – 79%
- Burbank – 68%
- Northridge – 68%
- Glendale – 64%
- Valencia/Santa Clarita – 54%
- Pasadena – 50%
- Reseda – 43%
- Palmdale – 38%
- Los Angeles – 32%
- Encino – 23%
A Refresher on How We Determine Our Absorption Rates
Before we dive into these numbers, let’s just go over some key points as a refresher from last month:
- We only count single family homes. No condos. No townhouses. Why? For our clientele, it’s a more accurate representation of their interests.
- We can feasibly use absorption rates as an indicator of whether we’re moving toward a buyer’s or seller’s market. Generally, anything above 20% is considered a healthy seller’s market. Anything at 15% or below favors a buyer’s market.
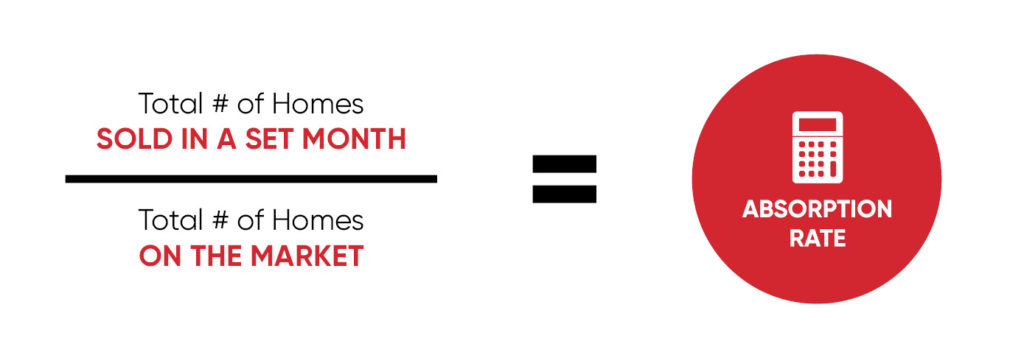
- Absorption rate expressed as a percentage shows us the number of homes sold over a set period of time. This is figured using the following formula:
Are September’s Numbers Indicative of a Strong Seller’s Market?
As we mentioned, September’s numbers show the majority of our neighborhoods moving even deeper into a seller’s market. What does this mean exactly? It means that these homes are moving more quickly off the market.
In August, we didn’t see any neighborhoods dipping below the 20% threshold used to indicate a healthy seller’s market. And that trend continued into September. However, one neighborhood did inch closer to that line. Encino actually dropped 7 percentage points for an absorption rate of 23%; just above the threshold of a healthy seller’s market. This also firmly places them as our neighborhood with the lowest absorption rate for September. In fact, Encino is nine percentage points beneath the next lowest area. That would be the city of Los Angeles itself at 32% (three percentage points higher than its August absorption rate).
The Biggest Differences in Absorption Rate
Our biggest turnaround for September was the Valencia/Santa Clarita area. It now boasts a 54% absorption rate, up a stunning 18 percentage points from August’s 36%. This makes sense as more homes were sold around Valencia and Santa Clarita while fewer homes were added to the market.
We saw another major rise in the area with August’s lowest absorption rate. Palmdale saw a surge of 13 percentage points this month, putting the desert locale at a 38% absorption rate. It just shows you how quickly tides can turn in the current market.
Photo credit: Envato
It’s also worth mentioning that both Long Beach and Pasadena saw significant gains of 10 and nine percentage points, respectfully. So, for anyone debating whether the time is right to sell, these numbers are illustrating that people will still buy in the face of higher interest rates.
Two Areas Trending Closer to a Buyer’s Market
But we also saw a couple of neighborhoods moving more toward a buyer’s market. Admittedly, this was a less aggressive drop than the rising absorption rates we just discussed. The aforementioned Encino area earned the steepest drop with seven percentage points. It was enough to net the valley neighborhood our lowest absorption rate for the month of September. While Encino is still firmly above the traditionally accepted 20% threshold for a solid seller’s market, the data indicates it’s a friendlier market for buyers.
The only other neighborhood to drop was Reseda with a single percentage point, reducing it to a 43% absorption rate. It’s almost a negligible amount, but one still worth noting in a month when seven out of 10 areas are on the rise.
The Highest Absorption Rate and the One That Broke Even
Long Beach retained its crown effortlessly as the area with the highest absorption rate. In fact, the city took a comfortable lead over the other areas by over 10 percentage points.
Photo credit: Jon Sullivan
In the heavily fluctuating housing market, only one neighborhood treaded water. Glendale remains solidly at a 64% absorption rate. However, fewer Glendale homes were sold this month, just as fewer homes entered the active inventory.
The Greater Los Angeles Area is (Arguably) a Seller’s Market
If we follow that higher absorption rates indicate more of a seller’s market, then most Greater Los Angeles neighborhoods just got more seller-friendly. But as Harout pointed out in our last Absorption Rate Analysis, parameters aren’t so cut and dry when you factor in regional influence. Ultimately, it’s up to the professionals to take the statistics for their areas of focus and interpret their specific meanings. We clearly see a strong pull in the direction of a seller’s market. But that can mean something wildly different from neighborhood to neighborhood.

